
Page 245 - บทความแนวปฏิบัติที่ดี KM มทร.+2 ครั้งที่ 10
P. 245
239
include Australia, the Philippines, Indonesia, Saudi Arabia and Malaysia respectively for the
market are mainly imported from Japan. When comparing the value of exported and
imported, Thailand's trade surplus in automotive industry. Analysis of the determinants of
Automotive Demand for exports of Thailand to Australia. Using secondary data annually
since 2542 - 2558 by Ordinary least squares method showed that Thailand's auto exports to
Australia, depending on the gross domestic product of Australia and the relationship that is
in the same direction, the gross domestic product increased by one percent to make
automotive exports increased by 4.49 percent, which is based on assumptions. It also
depends on exchange rate and correlation in the opposite direction, that is, if the exchange
rate rises 1 percent makes automotive exports fell 4.60 percent, which does not conform to
the assumptions set forth. Show that export demand vehicles depends primarily economic
importer. Therefore, expanding export markets to other countries more for reduces the risk
of exports.
Key words: Analysis of Demand for Automotive Export
บทน า
ยานยนต์เป็นอุตสาหกรรมที่มีความส าคัญและได้รับการส่งเสริมการลงทุนจากภาครัฐมาตลอดตั้งแต่
แผนพัฒนาเศรษฐกิจและสังคมแห่งชาติฉบับที่ 1 พ.ศ. 2504 ทั้งนี้เพราะเป็นอุตสาหกรรมที่ท าให้เกิดการจ้าง
งาน และการเชื่อมโยงไปยังอุตสหกรรมอื่นๆ ที่เกี่ยวข้อง ซึ่งท าให้เศรษฐกิจขยายตัวมากขึ้น ผลของนโยบาย
ส่งเสริมของภาครัฐท าให้ประเทศไทยเป็นศูนย์กลางการผลิตอุตสาหกรรมยานยนต์ในภูมิภาค และยานยนต์เป็น
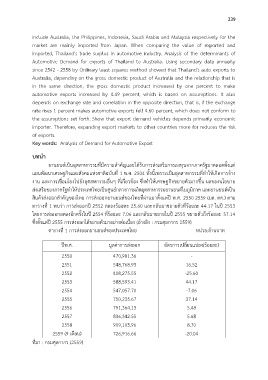
สินค้าส่งออกส าคัญของไทย การส่งออกยานยนต์ของไทยที่ผ่านมาตั้งแต่ปี พ.ศ. 2550-2559 (มค.-ตค.) ตาม
ตารางที่ 1 พบว่า การส่งออกปี 2552 ลดลงร้อยละ 25.60 และกลับมาขยายตัวที่ร้อยละ 44.17 ในปี 2553
โดยการส่งออกลดลงอีกครั้งในปี 2554 ที่ร้อยละ 7.06 และกลับมาขยายในปี 2555 ขยายตัวถึงร้อยละ 37.14
ซึ่งตั้งแต่ปี 2555 การส่งออกได้ขยายตัวมาอย่างต่อเนื่อง (อ้างอิง : กรมศุลกากร 2559)
ตารางที่ 1 การส่งออกยานยนต์ของประเทศไทย หน่วย:ล้านบาท
ปีพ.ศ. มูลค่าการส่งออก อัตรการเปลี่ยนแปลง(ร้อยละ)
2550 470,981.36 -
2551 548,768.93 16.52
2552 408,275.55 -25.60
2553 588,593.41 44.17
2554 547,057.70 -7.06
2555 750,235.67 37.14
2556 791,364.13 5.48
2557 836,342.55 5.68
2558 909,103.96 8.70
2559 (9 เดือน) 726,916.66 -20.04
ที่มา : กรมศุลกากร (2559)